Colored city maps
Thomas Niederberger January 25, 2016 #art #map #do it yourselfMy last art project was about generating maps of cities and printing them on canvases. The plan was to use 4 cities and print each city onto a separate canvas.
Three cities were obvious choices: Zurich, Barcelona and Chicago, but to decide on the fourth took me quite some time. In the end I settled on Osaka, Japan. It's the only one of the cities I haven't visited yet (hope this changes soon).
Each city was supposed to have a different color and it took me a while to find a way how I can extract the maps from Google maps (I also considered OpenStreetMap). I used a simple HTML file that used the Google maps API to set the center of the image and the colors for buildings, streets, water and trains. Paletton proved to be a great tool to experiment with different color schemes. Finally I used the Screenshoter add-on for Firefox to store high resolution images of each map. Then I just sent the image to a photo service that printed it on a canvas.
This is how the final colors of the cities looked when I ordered them: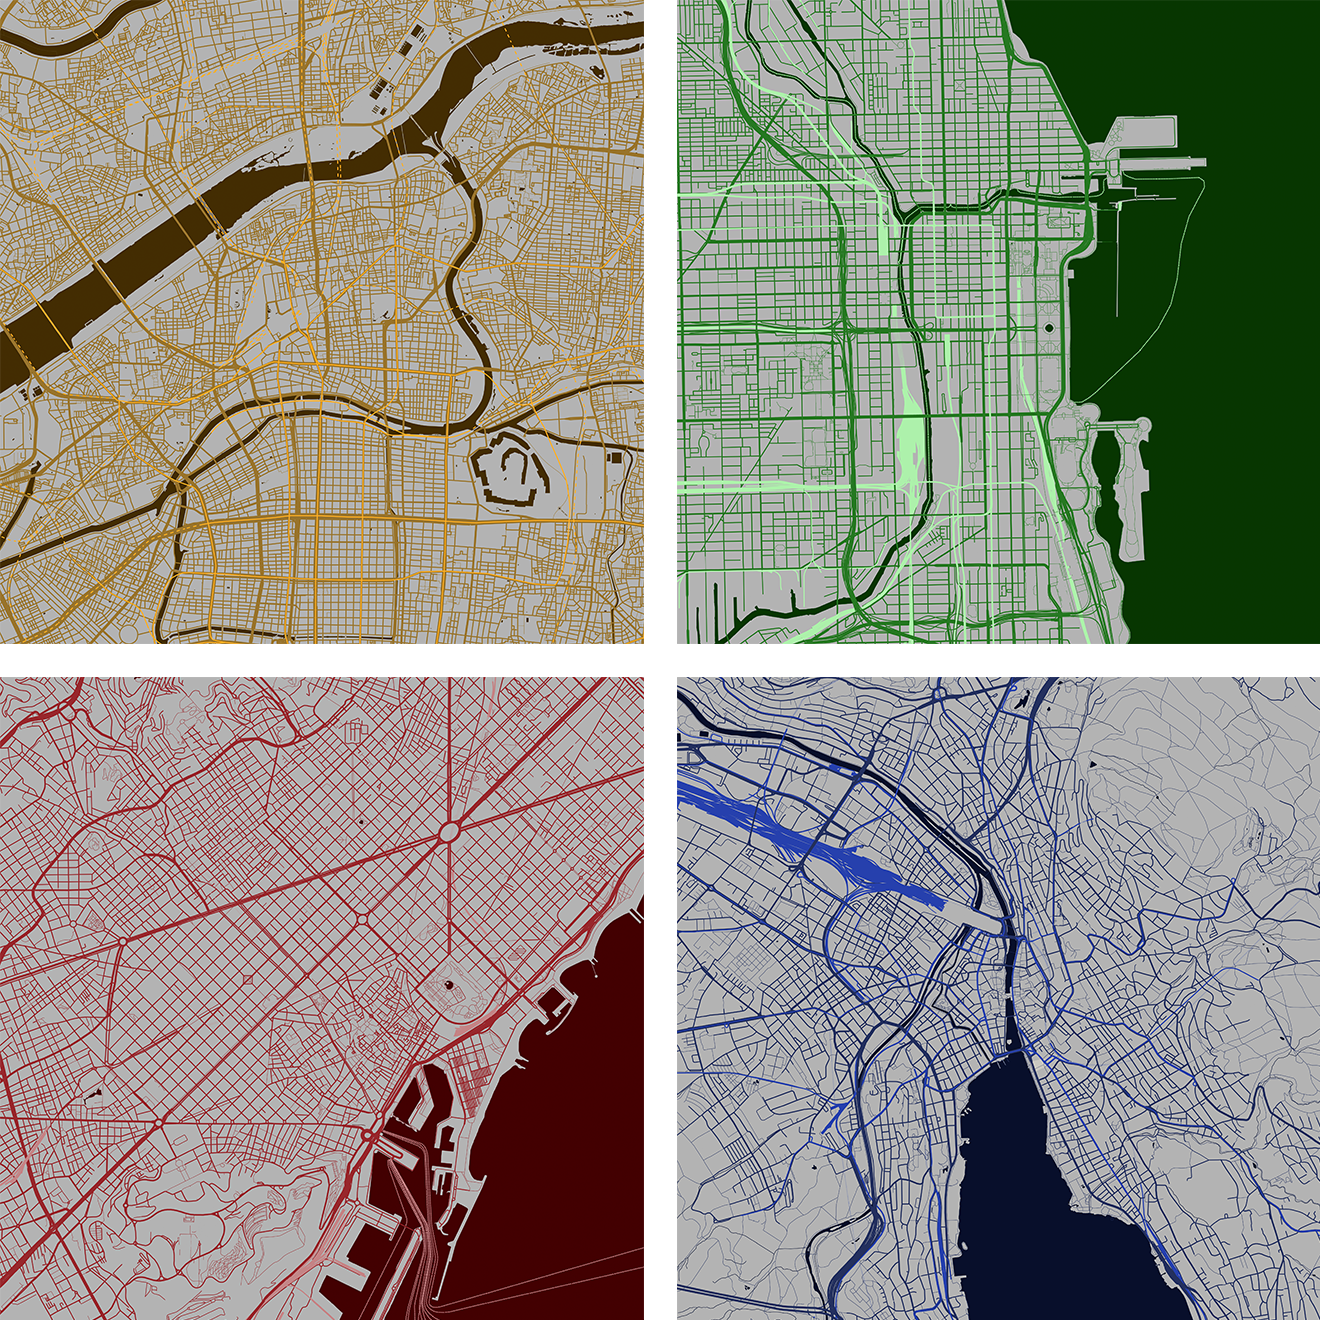
I like that the maps look abstract but still have a very real interpretation.
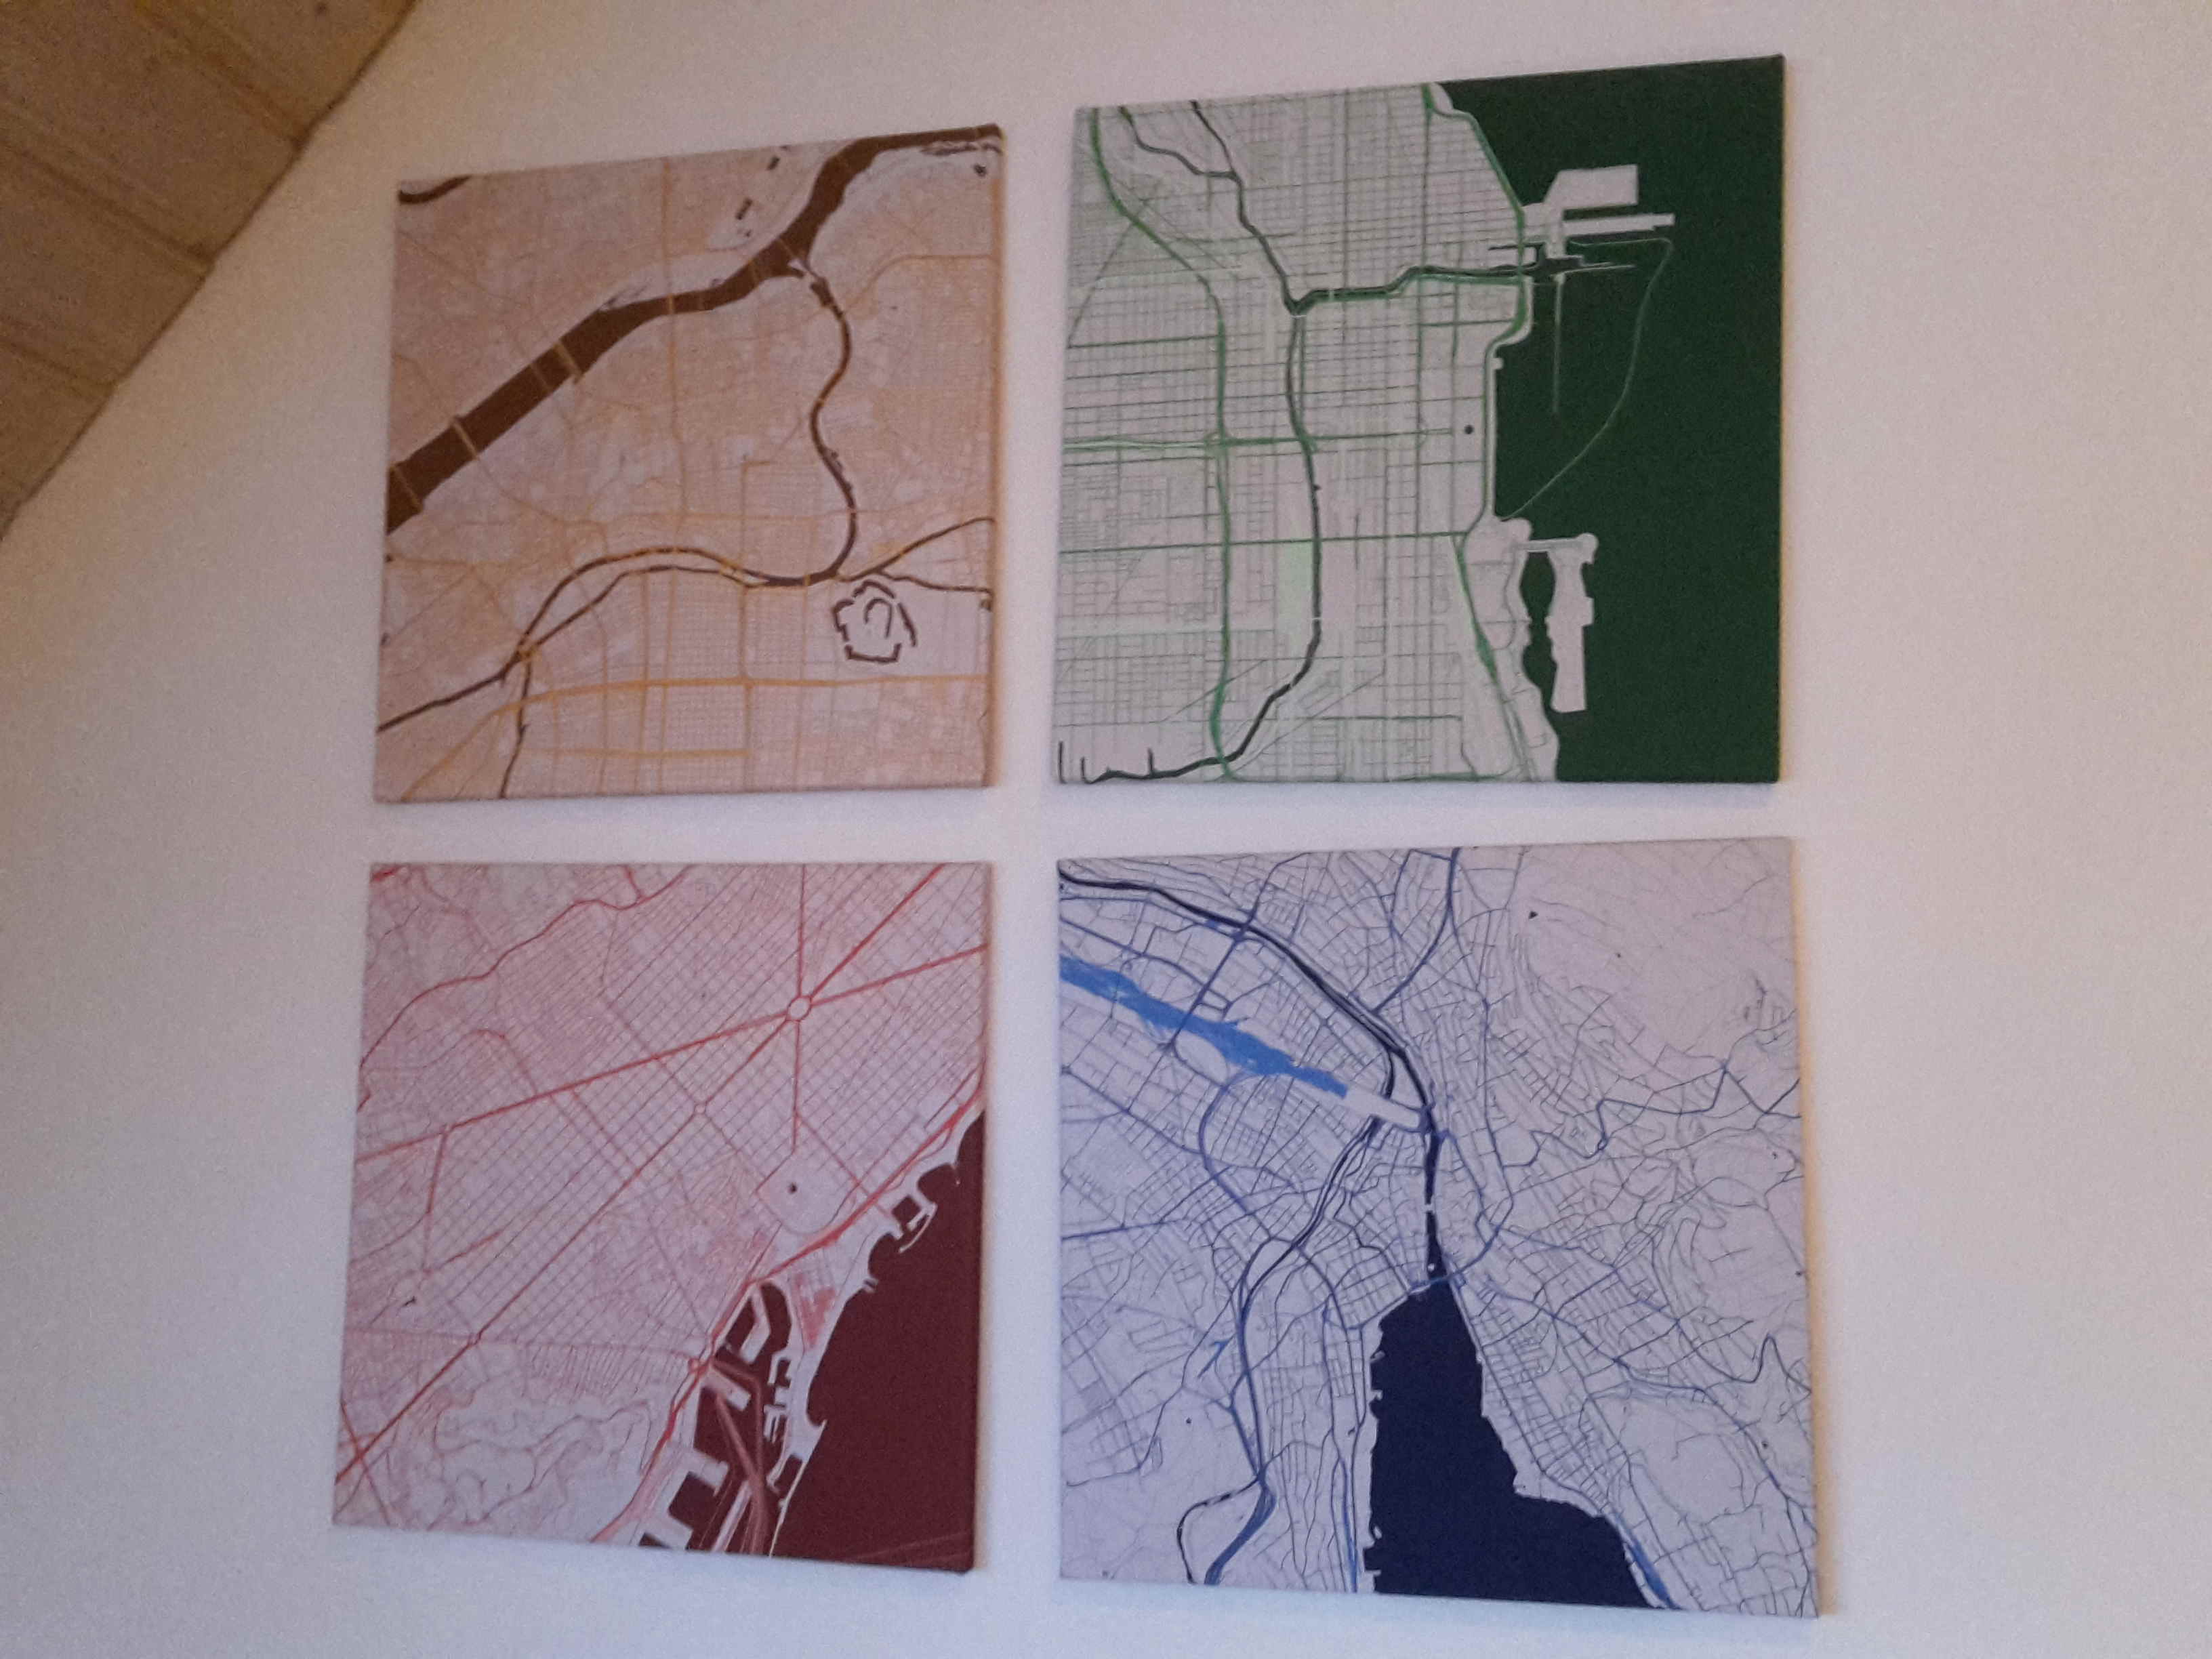
This is how the canvases look mounted onto the wall in my living room
Here is the HTML script, each city used different colors (and of course a different center position):
<!DOCTYPE html>
<html>
  <head>
    <style>
      #map_canvas {
        width: 4000px;
        height: 4000px;
      }
    </style>
    <script src="https://maps.googleapis.com/maps/api/js"></script>
    <script>
      function initialize() {
        var map_canvas = document.getElementById('map_canvas');
    building = "#C0C0C0";
    nature = building;
    //barca
    /*transit = "#FFBBCC";
    road = "#C00108";
    water = "#993300";*/
    //chicago
    /*transit = "#CCFFBB";
    road = "#2C6700";
    water = "#004040";*/
    //zurich
    /*transit = "#6600CC";
    road = "#5E9DC8";
    water = "#0C2C52";
    nature = "#C0C0C0";*/
    //Osaka
    /*transit = "#CC9900";
    road = "#663300";
    water = "#CC6600";*/

    //barca
    transit = "#FFAAAA";
    transit = "#FF0606";
    transit = "#d09797";
    road = "#AA3939";
    water = "#550000";
    //Osaka
    transit = "#FFE4AA";
    transit = "#FFBB2D";
    road = "#AA8639";
    water = "#553A00";
    //zurich
    /*transit = "#7986AC";
    transit = "#3257BB";
    road = "#2F4172";
    water = "#061439";*/
    //chicago
    /*transit = "#FF0000";
    //transit = "#88CC88";
    //transit = "#15B115";
    //transit = "#a3dfa3";
    transit = "#b9f1b9";
    road = "#2D882D";
    water = "#004400";*/
        var map_options = {
  		  //Barca
  		  center: new google.maps.LatLng(41.386963, 2.169908),
      //Osaka
      center: new google.maps.LatLng(34.702470, 135.500661),
      //Zurich
      //center: new google.maps.LatLng(47.371177, 8.540492),
      //Chicago
          //center: new google.maps.LatLng(41.876115,-87.626142),
      //St Petersburt
      //center: new google.maps.LatLng(59.929995, 30.310119),
      //Stockholm
      //center: new google.maps.LatLng(59.329728, 18.067818),
      //Teheran
      //center: new google.maps.LatLng(35.686039, 51.388174),
          zoom: 16,
          mapTypeId: google.maps.MapTypeId.ROADMAP
        }
        var map = new google.maps.Map(map_canvas, map_options);
    map.set('styles', [ { "stylers": [ { "visibility": "simplified" } ] },{ "elementType": "labels", "stylers": [ { "visibility": "off" } ] },{ "featureType": "poi", "stylers": [ { "visibility": "off" } ] },{ "featureType": "landscape.man_made", "stylers": [ { "color": building } ] },{ "featureType": "road", "stylers": [ { "color": road } ] },{ "featureType": "landscape.natural", "stylers": [ { "color": nature } ] },{ "featureType": "transit", "elementType": "geometry", "stylers": [ { "visibility": "simplified" }, { "color": transit }, { "weight": 6 } ] },{ "featureType": "water", "stylers": [ { "color": water } ] } ]);

      }
      google.maps.event.addDomListener(window, 'load', initialize);
    </script>
  </head>
  <body>
    <div id="map_canvas"></div>
  </body>
</html>
Also available on Github